Managing a project can feel like juggling multiple priorities, tight deadlines and shifting expectations. Without clear visibility, it becomes difficult to know if your team is making progress. This is where Project Management KPIs make the difference, helping teams turn tasks into measurable insights and gain better control of performance and outcomes.
With every year, projects become faster and more data-driven, which means relying on Key Performance Indicators (KPIs) for Project Management is crucial. These metrics enable smarter decisions, continuous improvement, and help teams deliver high-quality business results. In this blog, you will explore Project Management KPIs, how to identify the right one, and more.
What are Project Management KPIs?
Project Management KPIs are measurable metrics used to track a project’s performance against its key objectives. They focus on the core elements of a project, including time, cost, scope, and quality, helping teams understand whether the project is on track.
By monitoring these KPIs for Project Management, Project Managers can assess progress, identify risks, and ensure that tasks are completed within budget and meet required standards. This enables better control, informed decision-making, and successful project delivery.

16 Key Project Management KPIs to Track
Below are 16 key Project Management KPIs every team should track to stay aligned with goals and ensure successful, data-driven project delivery. Let’s dive in:
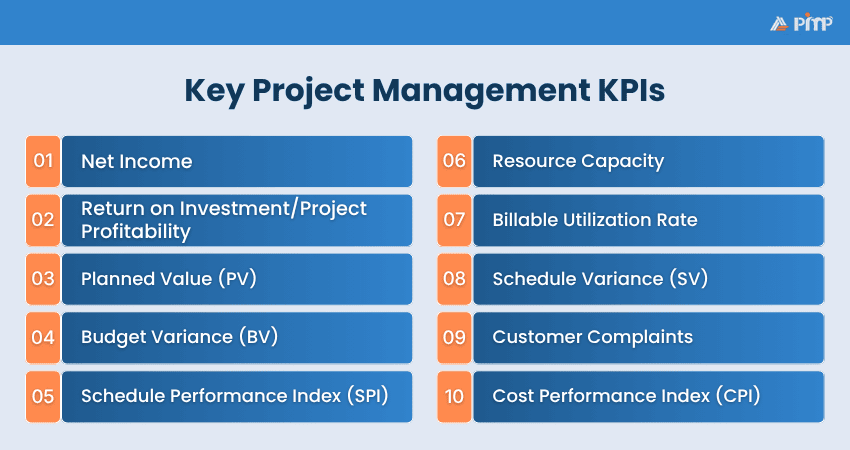
1) Net Income
Net Income is a key financial KPI that measures the profitability of a project. It represents the amount remaining after every project-related expense, including operating costs and taxes, is deducted from the total revenue.
This KPI helps teams understand how cost-effective a project is and whether it has achieved its expected financial outcomes. A positive net income indicates strong financial performance, while a negative value highlights the need to review costs and improve efficiency.
2) Return on Investment/Project Profitability
Return on Investment (ROI) measures how much financial value a project generates compared with what it costs to deliver. It helps Project Managers understand if a project is producing beneficial returns and whether the investment has been financially effective.
The formula is:

A higher percentage shows that the project is generating stronger returns, while a negative result suggests that costs may be too high compared with the value delivered.
3) Planned Value (PV)
Planned Value (PV) shows the approved budget for the work that was scheduled to be completed by a specific point in the project. It is an Earned Value Management metric that helps teams compare what should have been completed against actual progress and spending.
The formula is: PV = Planned % of Work Completed × Budget at Completion.
A higher PV means more budgeted work was planned to be completed by that time, which makes it useful for checking whether the project is progressing as expected.
4) Budget Variance (BV)
Budget Variance (BV) measures the difference between what the project was expected to cost and what it has cost at a given point. It helps to see if spending is under control and identify areas where the project may be overspending or performing better than expected financially.
The formula is commonly written as: BV = Budgeted Cost of Work Performed - Actual Cost of Work Performed. A positive result means the project is under budget, while a negative result means it is over budget.
5) Schedule Performance Index (SPI)
Schedule Performance Index (SPI) measures how efficiently a project is progressing compared with the planned schedule. It shows whether the team is completing work at the rate originally planned, making it one of the most useful KPIs for tracking schedule performance.
The formula is:
SPI = Earned Value (EV) / Planned Value (PV)
An SPI of 1 means the project is on schedule, a value above 1 means it is ahead of schedule, and a value below 1 means it is behind schedule.
6) Resource Capacity
Resource Capacity measures the availability and capability of team members and other resources to complete project tasks. It helps to understand whether they have the right people, skills, and time available to meet project demands without overloading the team.
By tracking resource capacity, teams can identify potential bottlenecks and avoid resource conflicts proactively. This enables better planning, balanced workloads, and ensures that projects are delivered efficiently without any delays.
Build a strong Project Management foundation with Certified Associate in Project Management (CAPM) ® Training now!
7) Billable Utilization Rate
The Billable Utilization Rate measures the percentage of time team members spend on billable work compared to their total available working time. It is a key indicator of productivity, especially in service-based or client-focused projects.
The formula is:

A higher rate indicates efficient use of resources, while a lower rate may highlight underutilization. Also, this KPI prevents burnout by spotting overworked resources and enabling better task allocation.
8) Schedule Variance (SV)
Schedule Variance (SV) measures whether a project is ahead or behind schedule by comparing the value of work completed with what was planned. It provides a clear indication of schedule performance.
The formula is: SV = Earned Value (EV) – Planned Value (PV).
A positive value means the project is ahead of schedule, while a negative value indicates delays. This KPI helps Project Managers take timely corrective actions to keep the project on track.
9) Customer Complaints
Customer Complaints is a quality-focused KPI that tracks the number of issues or concerns raised by customers during or after project delivery. It provides direct insight into how well the project outcomes meet customer expectations.
This KPI does not require a complex formula, as it is simply the total number of complaints recorded over a specific period. Also, monitoring trends over time helps teams identify recurring issues, improve quality, and enhance customer satisfaction.
10) Cost Performance Index (CPI)
The Cost Performance Index (CPI) measures the cost efficiency of a project by comparing the value of work completed to the actual cost incurred. It is a key indicator of whether a project is staying within budget.
The formula is:
CPI = Earned Value (EV) ÷ Actual Cost (AC)
A CPI greater than 1 indicates cost efficiency, meaning the project is under budget, while a value below 1 show that costs are exceeding the planned budget.
11) Earned Value (EV)
Earned Value (EV) measures the actual value of the work completed at a specific point in time. It is a key metric in Project Management that helps to assess how much of the planned work has been successfully delivered in terms of budget.
This KPI in Project Management is used to evaluate progress and performance by comparing completed work against what was planned. A higher EV indicates that more value has been delivered, helping to understand if the project is progressing as expected.
12) Cycle Time
Cycle Time tracks the total time taken to complete a task, process, or entire project. It provides insights into how efficiently work is being completed and helps identify delays in project execution.
By monitoring cycle time, teams can compare completion time with planned timelines, identify inefficiencies, and improve productivity. Reducing cycle time leads to faster delivery and better project performance.
13) On-time Completion
On-time Completion measures the percentage of tasks completed within the planned schedule. It is a strong indicator of a team’s ability to meet deadlines and manage time effectively.
This KPI helps identify delays and performance gaps, enabling teams to take corrective action. A high on-time completion rate reflects efficient planning and execution, while a lower rate highlights the need for better Time Management.
14) Time Spent
Time Spent refers to the total time taken by team members to complete project tasks. It helps Project Managers track effort and compare it with planned estimates to evaluate efficiency.
By analyzing time spent across tasks, teams can identify areas where work is taking longer than expected. This insight improves planning accuracy and optimizes resource allocation in future projects.
15) Percentage of Tasks Completed
This KPI measures the proportion of completed tasks relative to the total number of tasks in a project. It provides a clear view of the overall project progress and how much work remains.
The formula is:
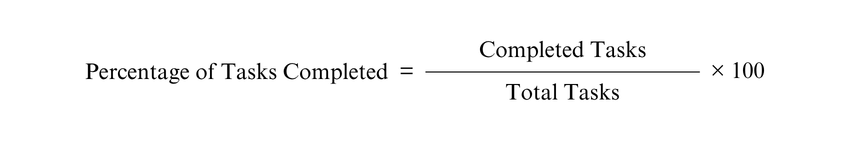
Tracking this regularly helps teams stay on schedule, identify delays early and ensure steady progress.
16) Project Burn Rate
Project Burn Rate measures how quickly a project is using its allocated budget over a specific period. It helps to understand spending patterns and whether the project is likely to exceed its budget.
The formula is: Project Burn Rate = Total Project Budget ÷ Project Duration.
A higher burn rate indicates faster spending, which may signal budget risks, while a lower rate suggests more controlled budget usage.
Lead program success at a strategic level with Program Management Professional (PgMP)® Certification - Sign up today!
How to Identify the Right KPIs for Your Projects?
Choosing the right KPIs ensures you track what truly matters and measure project success effectively. Let’s look at the keyways to identify it below:
1) Define Clear Project Objectives: Start by identifying what your project aims to achieve. Choose KPIs that directly align with these goals, such as cost, time, or quality metrics.
2) Align KPIs With Project Goals: Select metrics that reflect your key priorities. For example, if cost efficiency is important, focus on KPIs like cost variance.
3) Consider Project-specific Factors: Every project is different, so base it on its unique characteristics, such as complexity and remote collaboration needs.
4) Involve Key Stakeholders: Engage Project Managers, team members, and stakeholders to gain insights and ensure the KPIs are relevant and practical.
5) Review and Update KPIs Regularly: As the project progresses, revisit your KPIs to ensure they remain aligned with changing priorities and project conditions.
How KPIs Improve Project Success?
Tracking KPIs plays a key role in project success by providing clear insights into performance, progress, and outcomes. By monitoring key metrics such as cost, schedule, and resource capacity, teams understand how a project is performing and identify improvement areas.
Also, KPIs enable data-driven decision-making, helping to allocate resources efficiently and stay within budget and timelines. They improve communication by offering a transparent view of progress and ensuring consistency in successful project delivery.
Conclusion
Project success depends on delivering value with clarity and efficiency. By tracking the right Project Management KPIs, teams can make informed decisions and stay aligned with their goals. These metrics reduce risks, improve performance, and enhance overall project outcomes. With the right KPIs in place, teams can consistently deliver high-quality results.
Build industry-ready Project Management skills with Project Management Institute (PMI)® Certification now!

 Back
Back
 Topics
 Courses


 04 Jul 2026

 Veronica Davis